Back to the overview
Managing wealth requires insight for informed decisions - Part 1 Private Equity J-curve
Private Equity (PE) investments are increasingly gaining popularity as part of diversified investment portfolios. This form of investment offers the potential for high returns but also comes with unique risks and challenges, including the well-known J-curve effect. In this article, we delve deeper into what exactly the J-curve entails within the context of PE investments, and how investors can manage it. Understanding the J-curve is essential for anyone considering investing in PE or looking to optimize their current investments.
What is the J-curve?
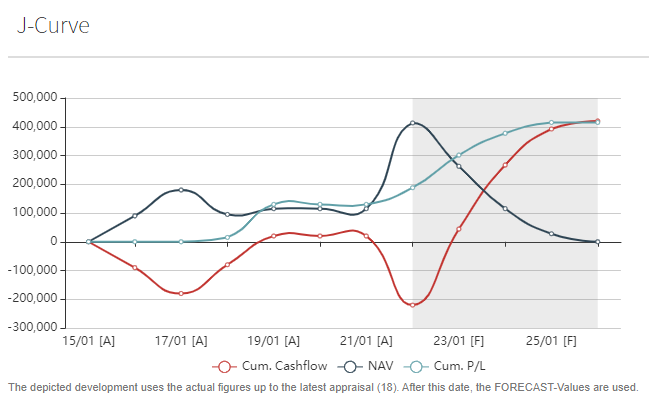
The J-curve is a term used in various disciplines, but within the context of Private Equity (PE) investments, it describes a specific phenomenon where the net value of an investment shows a decline shortly after the initial investment, followed by a significant increase after a certain period. This pattern visually resembles the letter 'J', hence the name.
This pattern can be explained by the following factors:
Startup Costs and Fees
At the beginning of a PE fund, investors face initial costs and management fees, while the investments have yet to begin generating returns. These costs contribute to the initial downward trend of the J-curve.
Valuation Adjustments
In the early years of the fund, the valuations of the underlying investments can be adjusted, often resulting in a lower perceived value. This is because many PE investments initially require additional capital and time to implement operational improvements and growth strategies.
Realization of Profits
As the fund matures, the investments made begin to bear fruit. Companies in the portfolio grow in value through operational improvements, market growth, or strategic acquisitions. This leads to higher valuations and, eventually, to profitable exits through sales or IPOs. These successful exits are what ultimately push the curve upward, reflecting the improvement in net returns.
Timing of Cash Flows
The J-curve also reflects the timing of cash flows in a PE fund. Initial expenditures (investments and fees) occur early, while incoming cash flows (from exits) happen later in the fund's lifecycle.
Understanding the J-curve is crucial for private equity investors, as it helps manage expectations regarding the timing of returns. It underscores the importance of patience and the long-term perspective needed when investing in PE funds. Investors must be willing to endure the initial period of lower or negative returns, with the confidence that the value will eventually rise as the investments mature.
The J-curve is an inherent part of Private Equity investments. By understanding the J-curve and the unique financial characteristics of PE investments, investors can make more informed decisions and implement strategies to manage the effect.
ITS provides a dynamic solution for visualizing the J-curve of each Private Equity investment, automatically generated based on existing transactions and standard earn-out models. For investors seeking a more personalized analysis, customization for each PE investment is also available.
With access to our Investor Portal, you are guaranteed an up-to-date overview of all your PE investments and characteristic financial indicators for your internal analyses and investment strategies.
ITS – Managing wealth requires Insight for Informed decisions.
If you also want to experience the benefits of our comprehensive and professional investment information for your PE investing, please contact me via email at Hroodhorst@itstrust.nl, by mobile at +31 (0)651502620, or fill out a contact request via our website Contact - ITS Trust (Contact).
What is the J-curve?
The J-curve is a term used in various disciplines, but within the context of Private Equity (PE) investments, it describes a specific phenomenon where the net value of an investment shows a decline shortly after the initial investment, followed by a significant increase after a certain period. This pattern visually resembles the letter 'J', hence the name.
This pattern can be explained by the following factors:
Startup Costs and Fees
At the beginning of a PE fund, investors face initial costs and management fees, while the investments have yet to begin generating returns. These costs contribute to the initial downward trend of the J-curve.
Valuation Adjustments
In the early years of the fund, the valuations of the underlying investments can be adjusted, often resulting in a lower perceived value. This is because many PE investments initially require additional capital and time to implement operational improvements and growth strategies.
Realization of Profits
As the fund matures, the investments made begin to bear fruit. Companies in the portfolio grow in value through operational improvements, market growth, or strategic acquisitions. This leads to higher valuations and, eventually, to profitable exits through sales or IPOs. These successful exits are what ultimately push the curve upward, reflecting the improvement in net returns.
Timing of Cash Flows
The J-curve also reflects the timing of cash flows in a PE fund. Initial expenditures (investments and fees) occur early, while incoming cash flows (from exits) happen later in the fund's lifecycle.
Understanding the J-curve is crucial for private equity investors, as it helps manage expectations regarding the timing of returns. It underscores the importance of patience and the long-term perspective needed when investing in PE funds. Investors must be willing to endure the initial period of lower or negative returns, with the confidence that the value will eventually rise as the investments mature.
The J-curve is an inherent part of Private Equity investments. By understanding the J-curve and the unique financial characteristics of PE investments, investors can make more informed decisions and implement strategies to manage the effect.
ITS provides a dynamic solution for visualizing the J-curve of each Private Equity investment, automatically generated based on existing transactions and standard earn-out models. For investors seeking a more personalized analysis, customization for each PE investment is also available.
With access to our Investor Portal, you are guaranteed an up-to-date overview of all your PE investments and characteristic financial indicators for your internal analyses and investment strategies.
ITS – Managing wealth requires Insight for Informed decisions.
If you also want to experience the benefits of our comprehensive and professional investment information for your PE investing, please contact me via email at Hroodhorst@itstrust.nl, by mobile at +31 (0)651502620, or fill out a contact request via our website Contact - ITS Trust (Contact).